Introduction
Low resistivity low contrast (LRLC) pay has been recognized as a significant problem in the prolific Miocene clastic succession of Cuu Long Basin. The main causes of this phenomenon remain ambiguous, which leads to difficulties in correcting for true resistivity and causes a loss of pay. This case study utilizes data from two mature blocks in Cuu Long basin where three out of five fields producing from the early Miocene succession encountered low-resistivity pay (Figure 1). The objective is to illustrate a workflow based on experimental charts, rock typing and saturation height modeling built on i2G platform that ultimately reduces uncertainties related to hydrocarbon reserve estimation. In general, there are many causes leading to this low-resistivity pay phenomenon:
- Thinly bedded reservoirs that are below log resolutions. There are advanced data that can greatly help with determining and characterizing this type of reservoir including NMR, Image Logs and 3D Resistivity Log
- Deep invasion zone by high salinity drilling fluids. LWD data is essential for confirming invasion zone.
- High salinity formation water. Water samples should be analyzed the saline contents so that an accurate Rw value is chosen
- High clay and capillary bound water contents associated with the presence of illite and/or a mixed layer of illite-smectite clay minerals. Dual water model can be applied but uncertainties remain as some parameters in the equation are difficult to determine
- Presence of highly conductive mineral such as Pyrite. Correction of resistivity log can be done as long as their concentrations are established
- High angle wells. Resistivity reading can be lower than the true values near sand-shale boundary due to a presence of two lithologies within volume of investigation
A thorough review of core data, LWD, fluid analysis results and other data suggests that the LRLC phenomenon in Miocene reservoirs in the studied area is caused by a combination of thinly bedded reservoirs, high salinity formation water and high bound water associated with weakly consolidated sediments and low-relief structure. Limited supporting data such as core, mineralogy, FMI and NMR prevents an accurate estimation of water saturation using physical model.

Workflow on i2G
This study utilizes corrected routine and special core analysis data, i2G cloud-based machine learning methods and J functions (Figure 2). Four flow units were identified on core data along with their petrophysical characteristics, poroperm relationships and J functions. Next, flow units were predicted in uncored intervals and in other wells without core data. Flow unit predictions were made in two ways. One was via FZI values using commonly used machine learning methods offered by i2G such as ANN, while the second approach was to predict flow units directly using Random Forest. The permeability of each flow unit was then estimated by applying its poroperm relationship. Finally, an experimental chart built from nearly 2000 core samples collected from Cuu Long basin and constructed J functions were employed to calculate Swir and Sw, respectively. In hydrocarbon zones where water saturation reaches Swir, values derived from the chart are reliable in reflecting pore space water content. These results have been verified by DST data and, more importantly, the synthetic Sw matches well with log-derived water saturation in normal resistivity pay zones. The estimation of fluid saturation in low-resistivity pay intervals also improves significantly, thereby adding significantly more net pay. Sw calculated from multiple J functions give the best results within the transition zone.

Results
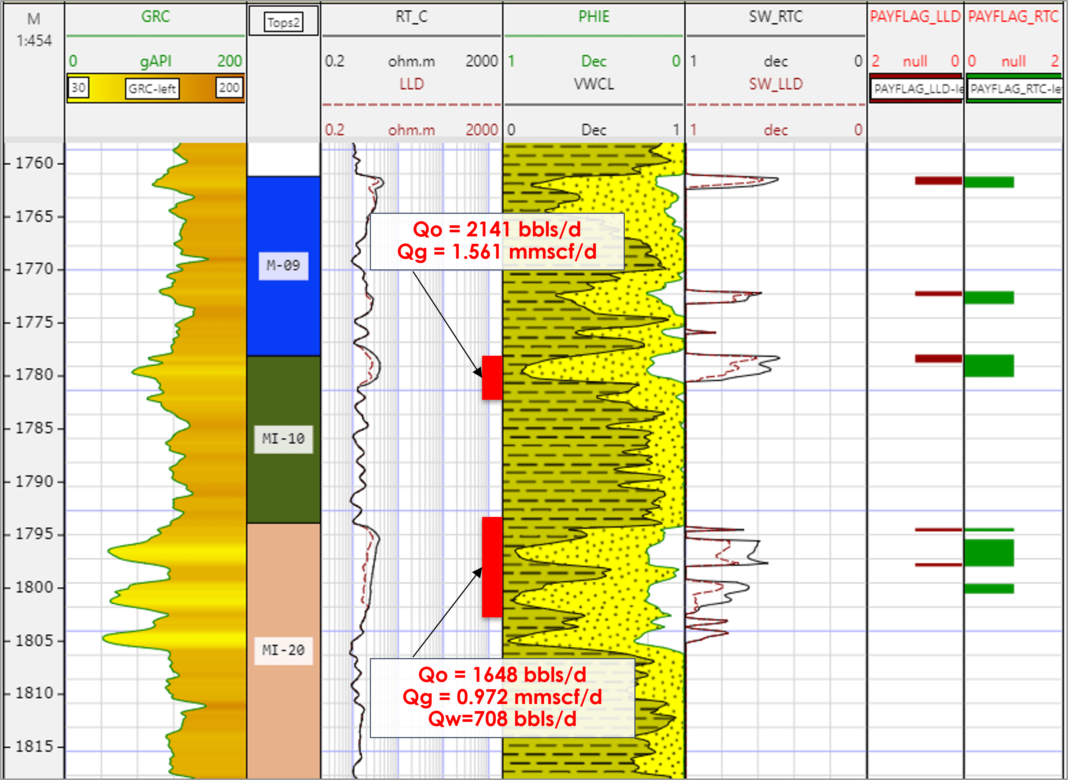
Figure 3 shows the Sw calculation results of two Miocene reservoirs which share the same FWL. The upper reservoir has not fully characterized as pay intervals using Sw calculated from original measured LLD although DST results have confirmed to be good oil flow interval with very low water cut. The final Sw results after applying the aforementioned workflow now reflect true fluid contents and the entire upper reservoir is eventually flagged as hydrocarbon pay. The re-calculated HIIP has increased by nearly 70% when compared with the number derived from original Sw.

Contact us if you want to know how to apply this workflow to your dataset.


